Overview
The Droplit Trace CLI is a cross platform command line tool that allows users to trace droplit.io events in real time. It is built on the Droplit WebSocket SDK.
The overall functionality of the Trace CLI is the same as the Droplit command line console, except that the Trace CLI tracks events in real time, and the normal Droplit CLI does not.
Installation
Install the Droplit Trace CLI using the same setup instructions as those listed for the Droplit command line console, depending on the type of operating system (Windows, Mac OS, or Linux/Embedded). The name of the Trace CLI package is slightly different than the package name for the normal Droplit CLI, so use the following command when installing the Trace CLI from NPM.
npm install droplit-trace-cli -g
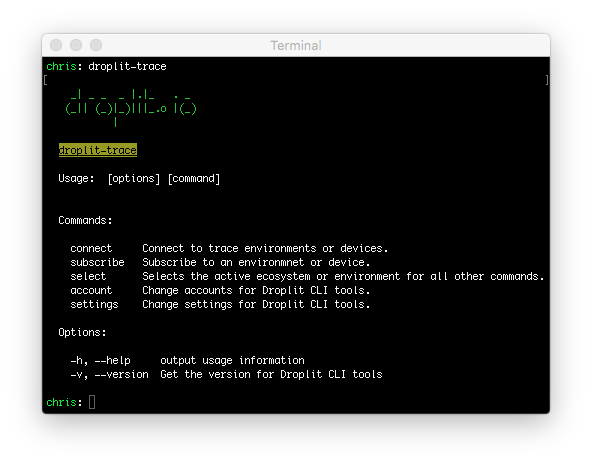
Top-Level Commands
Similar to the normal Droplit CLI, run droplit-trace on the command line to see a list of top-level commands.
Logging In
Users can log into the Droplit Trace CLI using their developer account credentials from the Droplit portal. This involves a similar command to the one which logs into into the normal Droplit CLI. If the user has already authenticated into the normal Droplit CLI, it is not necessary to authenticate a second time.
droplit-trace account authenticate
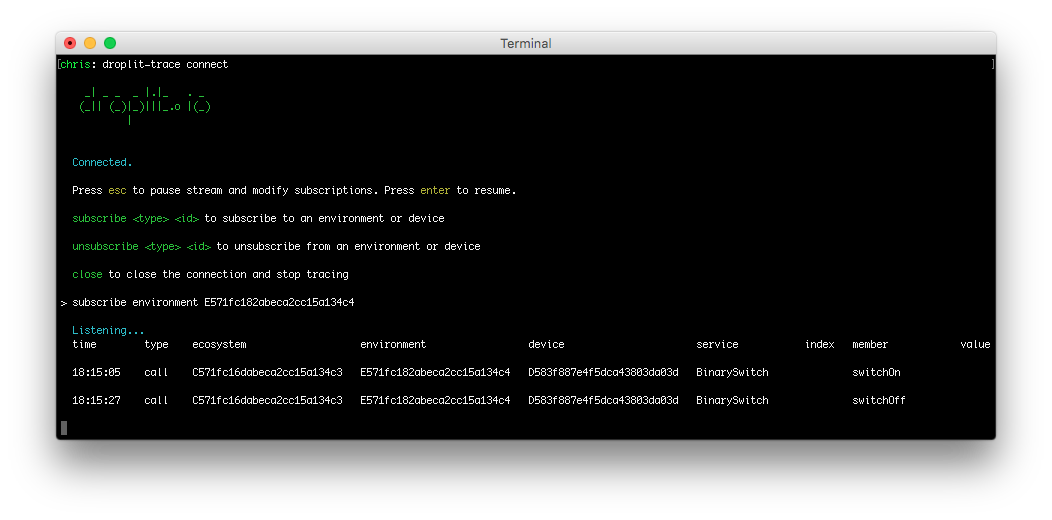
The Trace CLI, by default, does not run in interactive mode. To enable interactive mode after authentication, use the following command.
droplit-trace connect
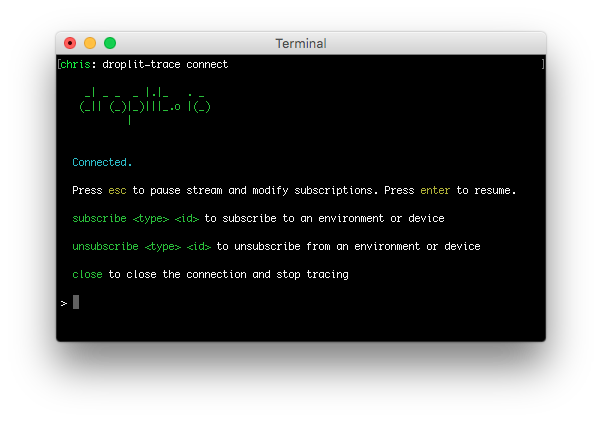
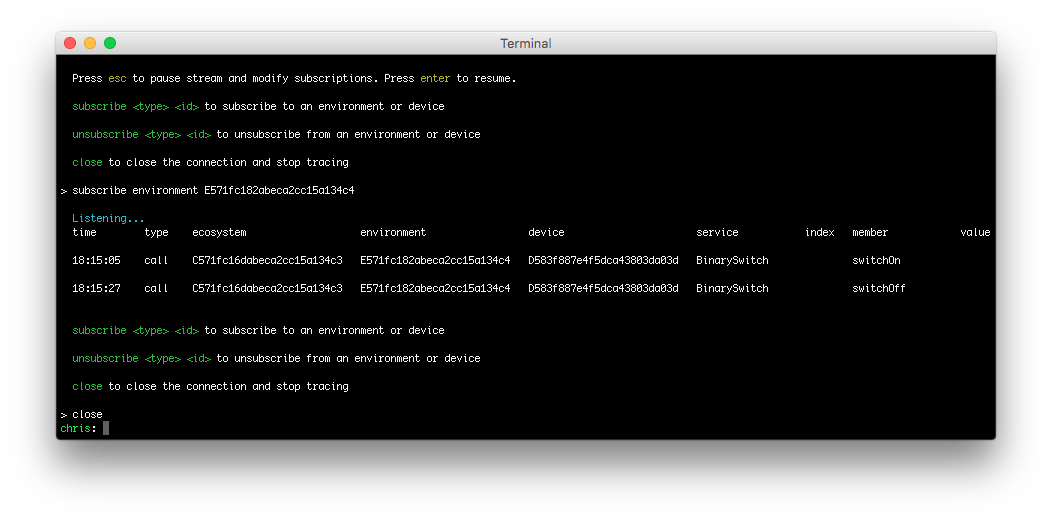
Subscribing to Resources
Directly subscribe to resources for monitoring using the following command. Resources are usually devices and other containers.
droplit-trace subscribe <resourceType> <resourceId>
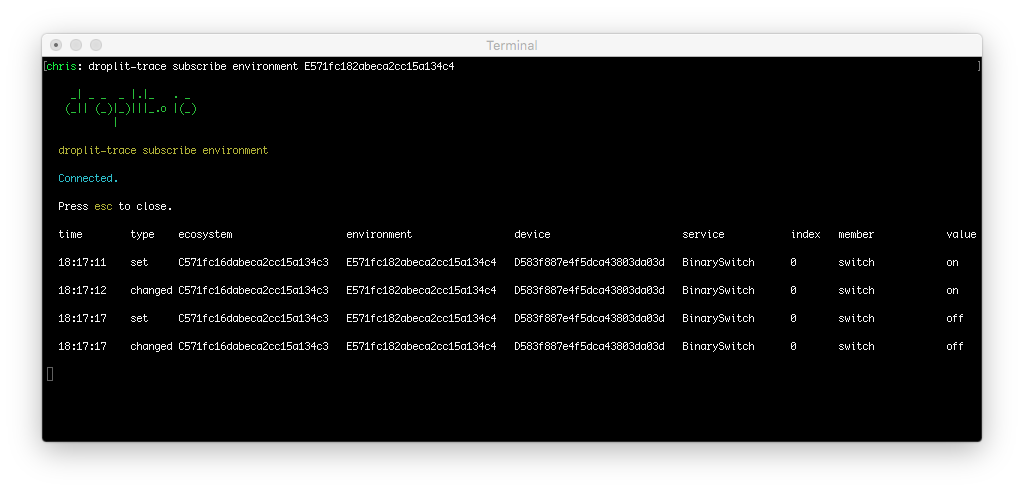
The web socket connection must be open to subscribe to resources. Interactive mode, if enabled, has more options available.
Exiting Interactive Mode
Exit the interactive CLI, if running, by pressing esc and typing close.